< Part 4: Supply evolution

Part 5: Upward mobility

Transportation affects the real world, creating a range of risks and trade-offs, so regulation has always been an important factor. But the rise of the trip economy has been particularly disruptive from a regulatory perspective. First came ridehailing, which launched a deployment blitzkrieg, capturing markets with relatively little resistance from regulators, especially in the US. Ridehailing skirted around existing definitions of taxi services and labor and leveraged pent up consumer frustration with taxi services in this battle, quickly winning a devoted following. Bike-sharing and then scooter-sharing adopted a similar strategy, asking for forgiveness rather than permission. Fleet operators dumped vehicles in cities virtually overnight, starkly polarizing urbanites in the process. However, by this point regulators had a better sense of how to think about new mobility and were more willing to create rules to govern these services and demand access to trip data. Enforcement also proved easier since shared bikes and scooters were easier to identify than unmarked cars operating on ridehailing networks. But in many ways, we are still in an experimental phase and there is limited understanding of best practices or long-term priorities.

Given this, what are frameworks and strategies that regulators can use in this environment of complexity, rapid change, risk and opportunity? And how should different types of infrastructure and externalities be prioritized? We explore this next.

The urban divide

CATs are, for the most part, city creatures. This is important because the key fault line of politics is increasingly along an urban vs exurban divide. In the US, cities are blue and basically everywhere else is red; consider that Biden's electoral victory in swing states came from votes from dense urban areas such as Philadelphia, Detroit and Atlanta. And this is true not just for the US. Take a look at these maps showing a striking correlation between voting patterns and population distribution for the 2019 UK General Election. Even in multiparty parliamentary democracies like Sweden the trend is consistent.

Globalization is about inter-urbanization. Cities are often more connected to one another than to the rural area around them in terms of both trips and travel time. Even across international borders there is often more that cities have in common with each other than the areas around them with respect to cultural norms, experiences and concentration of wealth. This impacts directly on how people think, communicate and organize around issues like immigration, employment, taxation, LGBTQ+ rights, public safety and many other issues besides. Meanwhile, digital aggregation and technology deployment are usually focused on cities. The rapid velocity and high connectivity of cities is why they are engines of economic opportunity and therefore a key driver of ongoing global urbanization trends.

As a result, there is a two-way feedback loop at play when it comes to mobility policy. On the one hand, political divides affect how change is interpreted and what regulatory decisions are made. Conversely, mobility services are a defining characteristic of denser urban polities and therefore play a greater role in defining how people affiliate and which issues matter most to them.

Regulatory frameworks

The lenses through which we think through problems and opportunities help give us clarity on the best way to approach them. When it comes to mobility regulation, the perspective and the timing of regulation both matter.

Horizontal vs vertical

Regulation tends to flow along two separate axes. On the one hand, some decisions are made by local regulators beholden to a particular polity. Let's call this vertical regulation. On the other, some decisions are made at a state, national or federal level and affect broader groups of people. We'll call this horizontal regulation.

Horizontal regulation for mobility includes general rules that are broadly applied such as vehicle homologation and fuel efficiency standards for private vehicles, or subsidies for broad categories of infrastructure such as highways.

Vertical regulation tends to be more specific, considering rules and infrastructure within a local context. It includes land use policy, how enforcement occurs, what local infrastructure is built including transit and also how such projects integrate into broader systems. Since trips usually happen within a kind of local watershed, vertical regulation gives a way to holistically consider such an ecosystem. To this extent, paradigms (e.g. a default expectation of car ownership) and special interests (such as nimbyism) often shape the extent to which a city is open to new solutions. Shifting these paradigms can bring about broad changes.

Horizontal and vertical regulation exist in a kind of equilibrium in which various issues fall under the purview of different groups of regulators. Yet new technologies threaten these established norms for how power is divided, with the potential to create conflicts and uncertainty.

Take ridehailing in Austin as an example. In 2016 city regulators passed more restrictive rules for ridehailing, requiring fingerprinting as a part of driver background checks. Both Lyft and Uber threatened to leave and when a ballot measure they sponsored to overturn the rule failed, they both did so. Only over a year later, after the Texas state legislation passed more permissive ridehailing rules that superseded the Austin restrictions did they resume operations in the city.

Regulatory intervention card, "Return up to two target DOG or CAT cards to player's deck and shuffle the deck"

Another example of the interplay between horizontal and vertical rulemaking is autonomous vehicle regulation in the US. Traditionally vehicle homologation has happened at the federal level while regulating drivers is under the purview of states. However, since autonomy allows the work of the driver to be virtualized through technology designed into the vehicle, it smudges this distinction. To further complicate things, AV testing and development has happened on a city-by-city level. For now, it's not clear how rules will ultimately be set.

The internationalization of policy can also create similar tensions: European and Chinese fuel economy standards are forcing carmakers to shift their vehicle strategies for all markets since economies of scale push carmakers to standardize their platforms.

Some cities struggle with internal horizontal vs vertical regulatory tensions. London has been a laggard in permitting micromobility since the city is divided into 32 boroughs, with each borough council making policy decisions independent of others. The Greater London Authority, which was only established in 2000, is limited to making decisions about major highways and planning strategy. This fragmentation of regulation and power creates significant obstacles to addressing challenges and launching new services intended to serve the whole city.

Of course these things are complicated because regulation already moves slowly and mobility technology doesn't follow a neat local vs global dichotomy: Amazon delivers locally through a global distribution network while trip operators are generalizing policy approaches across a broad range of geographies. Just as mobility operators connect technological building blocks across layers of vehicles and between marketplaces and fleets, regulators too need to find ways to bridge the horizontal and vertical axes of government to adapt rules to shifting market needs.

Reactive vs proactive

A second framework for thinking about regulation is with respect to its timing. Speed is important in general and a major challenge for regulators since business models evolve quickly but the wheels of government turn slowly. There are usually two separate phases of regulatory response to new technology.

The first is reactive: there should be room for innovation and new models to be tested, but as they are launched, unintended consequences are revealed and sometimes these are best addressed through policy. This lens is subtractive to the extent that it is about minimizing harm and usually involves making tradeoff decisions.

However over time and with better understanding, there is also room to create policy in a way that is proactive. This is especially true from the vertical perspective which considers how systems interact as part of an integrated whole. This approach can be positive sum in nature, creating efficiencies as the overall size of the pie is grown.

Related to reactive and proactive approaches to legislation is whether the system is default-allow or default-deny. Legal systems in places like the US which derive from British common law tend to permit things by default (and then react to issues as they arise) whereas civil law systems such as Germany's generally need to explicitly permit new innovations.

Organization, metrics and capital

Rube Goldberg style drawing showing A) shifting mobility landscape creates new challenges and opportunities B) which must be filtered through the organizational structures of planning agencies C) allowing them to understand real-time and long-term shifts using a range of metrics D) and leverage capital E) to shift outcomes within the trip economy F) counteracting the current dominance of inefficient and heavily subsidized ownership modes

Schematic of optimal mobility policy decision making processes

Even when agencies have sufficient power to make decisions, they might not be organized in a way that allows them to act effectively. For instance, transit and road regulation and planning have been siloed into different parts of most organizations. There are separate pools of data, distinct software tools for running operations (with lock-in to specific vendors), discrete payment systems and budgets. What the trip economy offers is a framework for unifying these distinct silos, but it will require significant change on the part of how regulatory agencies are structured and how they understand their mandate.

Thus far, regulation has mainly responded to the trip economy reactively. It has been unclear who is ultimately responsible for what and therefore hard to capture new opportunities. For example, micromobility is often managed by a completely different department to the teams responsible for transit planning even though it can act as a bridge to public transportation. UberPool and Lyft Line have received little support from cities even though they offer positive externalities compared to non-shared ridehailing trips. Meanwhile rapidly growing delivery volume has created significant challenges for cities as parked vehicles block roads and increase congestion, but it has been painfully difficult for regulators to muster solutions.

Given that mobility is the lifeblood of cities and is the interface between all other aspects of urban planning, what is lacking is a consistent framework for tying together all transportation modes within a given mobility catchment area and balancing tradeoffs in the context of the broader urban landscape. This ties into the two key levers regulators hold: metrics and capital.

Metrics (including KPIs) are how the overall system is evaluated, giving insight into where things stand at a given moment in time while also making it possible to track progress towards long-term goals. Fundamentally, cities should have ways to benchmark the distribution of various trip modes and how much consumers spend on them - the concept of the Urban Transportation Wallet is a step in the right direction. There will also be a range of externalities such as safety, pollution and equity to factor in. Ideally these models will accurately capture the full costs of various trip types along with their benefits.

Based on such metrics, capital can be collected and deployed in order to structure incentives and shift outcomes. When both tools are combined effectively, overall outcomes should improve in a way that is accretive. Rather than dictating specific solutions, the mandate of regulation is to provide the context in which the trip economy can iterate solutions that more efficiently meet customer needs while regulators manage the public interest by pricing in negative and positive externalities.

A confluence of factors - technological advancement, new trip mobility business models, environmental policy, a global pandemic - offer an opportunity to reevaluate long held assumptions about how transportation planning is done. Data collection powered by technology makes it possible to track changes more precisely. And the pricing mechanisms of the trip economy gives exact levers to direct outcomes towards specific goals.

Return on infrastructure

Infrastructure is the context in which trips occur. The way in which urban space is allocated dictates the dynamics of our trip-punctuated lives. Since infrastructure takes up public space, it involves tradeoffs, especially in denser urban environments. It's therefore worth considering the way in which allocations are currently being made and how this should probably shift going forward.

Trip geometry and non-places

Diagram showing the four categories of places beyond the Home: Places (trip destinations), Places in Motion (trips that act as a Place), Non-Places (taking up space in between Places) and Virtual Places (in the digital realm)

Dematerialization has opened up virtual places that can substitute and supplement the physical places in which we live our lives outside the home, while places in motion are places that can be occupied while in transit. In addition to these categories, the physical world is also littered with what can be referred to as non-places, areas that we transition around or through to get to the places we take trips to reach. Examples of such non-places are the four types of thoroughfare infrastructure mentioned in Part 1 (people space, micromobility space, car space and transit space) as well as the infrastructure built up around them to support their use, including parking lots and garages. Connectivity is what makes cities valuable; non places are like cholesterol, healthy in limited quantities but in larger volumes block up the heart of a pulsing urban economy.

Car space

Cars are useful because they enable a wide range of trips with relative ease and in a way that is generally affordable. However, that value proposition is bumping up against fundamental limitations, especially in denser urban spaces. There are two big pieces to car infrastructure and each has significant issues, aggravated by public subsidies

Parking

The cost of building parking varies: surface parking cost between $5,000 and $10,000 to construct (including the value of the land the stall occupies), while garage construction costs are significantly higher at $25,000 to $50,000 per stall.

Buddy DOG card, "His life is spent patiently waiting for you to return"; he represents a Toyota Corolla; "Owner guidelines: Efficient and reliable, well bred and generally content. Dreams of walks along the beach, but mostly just sees the blocks around your home and office."

Parking is the quintessential non-space since it is space set aside for cars rather than people. For the most part, governments have allocated significant portions of high value real estate for on-street car parking while charging nothing or a significantly discounted rate for this amenity. Meanwhile off-street parking has been forced into existence by mandated parking minimums which bundle the cost of parking into the cost of real estate, subsidizing vehicle storage costs in the process. Such subsidization also means a glut in parking supply: for instance in Chicago, a third of apartment parking lots go unoccupied every night.

As a concrete example: In the Pacific Northwest, average parking requirements for apartments are about half the size of the apartment itself and when parking is built underground, it can form an even larger portion of the overall construction cost (see graphic below for specific requirements across the region).

Graphic showing living space vs parking space across Cascadia (US Pacific Northwest); median requirements are 1.5 parking saces per two bedroom apartment, which is close to the size of the apartment space

Source: Sightline Institute via Graphing Parking

Beyond the home, the sizes of the places we travel to from it are often similar to the non-space set aside for cars alongside them. Median parking requirements at schools across the US require that for a classroom with 30 desks, 6.17 parking spaces be set aside, a ratio of about 5:2 of learning space vs parking space. Churches require more parking space than worship space by a ratio of about 1:5.

Graphic showing parking set aside at schools (6.17 parking spaces per 30 student classroom, about 50% of the school space and double the class space) and places of worship (90 per 400 seat church, about 7.5x the worship space) across the US

Source: Sightline Institute via Graphing Parking

According to a study by the Research Institute for Housing America, in many cities spending per person on parking infrastructure approaches the cost of the average home.

Table showing total parking spaces, parking density, parking spaces per household, replacement cost of all parking and parking costs per household across New York, Philadelphia, Seattle, Des Moines and Jackson, WY

Source: Quantified Parking Report, Bloomberg CityLab summary

Let's zoom in on Seattle. The city has about 1.6 million parking spaces with a replacement cost estimated to be over $35 billion, meaning an allocation of $117,677 per household or $82,281 per vehicle in the city. Most of the cost of parking infrastructure in Seattle comes from off-street parking structures in the downtown core, but on-street parking alone is worth more than $9 billion, or almost double the estimated replacement value of every sidewalk in the city ($5.6 billion dollars).

Tika DOG card, "Love it, couldn't wear it"; she represents a luxury sports car; "Owner guidelines: This is one high maintenance bitch. Sleeps the vast majority of the time and eats high carb diet which is expended prodigally. Quite fragile, but looks stunning."

There isn't a clear reason why the government should subsidize or force others to subsidize the space that vehicles occupy when not in use. This space could be dedicated towards many other purposes (outdoor dining, parks, sidewalks, homes, etc). Car owners should bear the full cost of their transportation mode preference and as much as possible, the free market should determine the most efficient allocation of resources.

Not only is the space set aside for parking a significant contributor to construction costs, but it also results in spread out cities that are slower to traverse by car (especially as congestion worsens) and almost impossible to cover by foot or micromobility since the distances are so large. Non-spaces also raise the cost of services such as internet, electricity and sewage since more cabling or piping is needed to serve the same number of people. States like Oregon have started addressing this problem by reducing parking minimums, but the distortion remains significant and the costs will persist.

Japan provides a helpful counterpoint for what is possible: Tokyo is the largest and most productive city in the world, yet it feels compact and inviting since there is no on-street parking. Instead car owners have to cover the cost of a private plot of land to store their vehicle, incentivizing smaller and fewer vehicles and the use of transit.

Roads

The second portion of car infrastructure is the space through which vehicles travel. Roads form a broad network that supports a wide range of vehicles, from trucks to mopeds, with significant benefits from this network both on the local and national level.

Roads cost money to construct: $2-3m/mile in rural areas and $3-5m/mile in urban areas according to ARTBA. This may seem like a lot, but it's actually a lot less than transit and roads can be built quickly with new roads connected immediately into the broader network.

Grunt DOG card, "Big dog in the place to be (yo) Big dog in the place to be"; he represents a pickup truck; "Owner guidelines: Shaped for heavy duty work but frustrated to be trapped in the midlife crisis of its owner with its primary form of exercise to act as an emotional support."

The US has a total of 4,171,125 miles of road and 8,785,398 lane miles. Both numbers have grown only nominally over the last three decades. The scale of the US road network has become a challenge though: road infrastructure is degrading and gas tax collection has not kept pace with wear and tear as improved efficiency has lowered collections relative to road utilization. In 2017, federal spending on roads and highways was about $47 billion while state and local spending was close to triple that at $135 billion. The total spending has doubled since 1977 on an adjusted basis. Of the 616,086 bridges that form part of this road network, 1 in 3 of them is in need of repair or replacement.

The fundamental problem with road infrastructure is that it can't keep up with demand. There's a concept called induced demand: that improvements to road infrastructure only yield temporary relief before new demand brings back the congestion that the improvements sought to address. The root problem here is not people, who quite reasonably would like to do more things and go to more places. Rather the problem is roads, which only have the capacity to move about 2,000 people per hour per lane, a throughput insufficient for most urban areas even if you build many lanes. The simple problem with roads, which becomes more intractable as the network scales, is that though they are relatively cheap to construct, they don't have the ability to meet the throughput demands of most major cities.

Transit space

Transit is the highest throughput form of transportation, but it is also very expensive. Across the three levels of US government in 2018, about $22 billion went to transit construction and capital spending and another $34 billion to subsidizing operations. Compared with the approximately $181 billion spent by government on roads and highways, the ratio is about 3:10 in favor of car infrastructure. But given that only about 2.5% of trips are completed on transit, spending on transit is proportionally much higher.

Visual representation of US spending on transit infrastructure construction from 2010 to 2019, with the largest allocation going to light rail (191 miles of track, $20.1 billion in spend at a cost of $105.25 million per mile. Metro ($13.4 billion), regional rail ($5.9 billion), commuter rail ($2.5 billion), bus rapid transit (BRT) ($2.6 billion), streetcar ($1.9 billion) and Arterial rapid transit ($0.8 billion) make out the remaining categories; total spend of $47.5 billion

Source: The Transport Politic

The cost per mile for constructing transit infrastructure can be staggering. Seattle had the highest per capita transit spending in the US, even before the $54 billion Sound Transit 3 project, which will add 62 miles of light rail over the next 25 years, was approved by ballot measure in 2016. The $31.7 billion of this budgeted for light rail construction adds up to a staggering $510 million per mile of track. And such high costs are not unique to Seattle. New York's Second Avenue Subway has ballooned in cost to a breathtaking $3.5 billion per mile while the San Francisco Central Subway and the Los Angeles Regional Connector both come out at $920 million per mile.

Ernesto CAT card, "'I will never support big corporations as they want people to conform to their norms' (sent via iPhone)"; he represents light rail; "Staffing instructions: Organic, sustainable, on the right side of history. Has a clear sense of direction, but needs a lot of support to stay on track."

While tunneling through complex geography and around established infrastructure adds to the costs of some of these projects, US transit construction costs are outliers on a global basis. Alon Levy, who has researched factors driving up the cost of constructing transit infrastructure across geographies, notes: "Nearly all American urban rail projects cost much more than their European counterparts do. The cheaper ones cost twice as much, and the more expensive ones about seven times as much." Levy highlights a broad range of factors that drive up the cost of US infrastructure construction, ranging from construction techniques and design to the way contracts are structured and litigated as well as political incentives around transit infrastructure decision-making.

In addition to high construction costs, US transit operating costs and efficiency are impacted by organizational fragmentation. For instance, the San Francisco Bay Area has 24 separately operated transit agencies each with their own schedules, maps and fares. As a consequence, it is somehow much slower and yet also more expensive to take transit between Oakland and San Francisco than to make the same journey by car.

Inflated US transit costs mean that a budget sufficient for a full transit network in a different country is enough to fund just a single line in the US. Given this, many viable projects are simply unable to get off the ground. These challenges are amplified in our postpandemic world in which transit has seen dramatic declines in ridership and resulting budget shortfalls. Nevertheless, in sufficiently dense urban environments, in which car infrastructure is increasingly unable to meet trip needs (as demonstrated by rising congestion), transit offers a high throughput alternative which will remain important.

Pedestrian space

Pedestrian space has been built out in city centers and suburbs, but is almost always secondary to car space. In many places it isn't possible to get somewhere by walking because car infrastructure dominates so completely.

Bar chart showing the shifting proportion of non-car mode share in the US, with Pedestrian trips consistently forming the largest portion, followed by Other (which includes Micromobility) and finally Transit

Source: 2017 National Household Travel Survey

Nevertheless, according to the 2017 National Household Travel Survey, more than 10% of trips in the US were completed by walking in 2017, up from a bit more than 7% in 1995. Of those, social trips accounted for the largest share with 18% of such trips being completed on foot.

Roamio CAT card, "What's in a name? That which we call food deliver'd / By any other word would taste as good"; it represents a sidewalk delivery drone; "Staffing instructions: This little fluffball comes to you when you call but doesn't hang around for long. Occasionally gets stuck in a corner and needs to be coaxed out."

In contrast, walking forms only a small percentage of commute trips even in cities. Averaged across the largest 50 cities in the US, only 4.9% of workers walked to work although denser cities had larger shares: in Boston, 14% of workers walked to work while more than 10% did so in New York, Washington DC, San Francisco and Seattle.

Sidewalks are cheaper than roads to construct. Depending on how and where they are constructed, they can range in cost from something similar to roads to an order of magnitude cheaper. However, as noted earlier, cities tend to invest more in parking than in sidewalks. In addition, parking non-places and the expansiveness of car infrastructure extend walking distances, making it less viable.

Cities also spend less on maintaining pedestrian infrastructure: According to Seattle's budget, parking enforcement has a budget allocation about four times that of sidewalk maintenance ($15,013,173 vs $3,807,479). There are several other ways in which urban thoroughfare priorities are signaled. For instance, across the US, at intersections all directions of road traffic automatically get a green light in turn, but pedestrians have to press a "beg button" in order to receive permission to cross. Meanwhile cities hold residents responsible for shoveling snow from the sidewalk outside their homes, but use snowplows to sweep adjacent streets, an irony that this video vividly captures.

Micromobility space

The degree to which roads are prioritized ahead of infrastructure that supports alternate modes in the US is striking. Compared to the approximately $50 billion of federal spending on roads and highways in the US, in 2018 just $850 million or 1.8% of federal surface transportation funding went to sidewalk and micromobility lane construction. This number decreased to $795 million in 2019 and of this about 30% ($241 million) lapsed or was transferred to road construction.

Bar chart showing US state funding to infrastructure construction projects: Road-only projects consume 94.6% while 4.1% combines road infrastructure with Pedestrian and Micromobility infrastructure types; only 1.3% is used to build out infrastructure that doesn't include roads

Source: Lifting the Veil on Bicycle and Pedestrian Spending - League of American Bicyclists

On the state level, a recent report by the League of American Bicyclists found 94.6% of transportation infrastructure spending was dedicated to projects exclusively for cars with no bicycle or pedestrian facilities. In contrast, just 0.1% of spending went to dedicated micromobility infrastructure and 0.3% to pedestrian infrastructure. As the report notes, it's really hard to find transparent data on budget allocation and improving infrastructure spending transparency should also be a priority.

Scoota CAT card, "Me little, sometimes i just fall over on my side"; she represents an electric kick scooter; "Staffing instructions: Needy. Must be constantly fed or becomes unresponsive. Sometimes acts out and causes scratches. Short lifetime, but compensates with high energy and playfulness."

Micromobility lanes are cheaper to construct than roads, but not dramatically so since the nature of the infrastructure is quite similar although the footprint is about half the size (for instance, at the very high end this UK study puts the cost of constructing a "two-way physically segregated cycle superhighway" at around $3m/mile (£1.45m/km)). However, constructing multiple infrastructure types simultaneously creates significant savings since costs overlap. Micromobility lanes can be incorporated into existing roads by repainting the surface, but this solution is not ideal since mixed traffic creates significant safety risks. More controversially, roads can fairly easily be transformed into bike and pedestrian space by closing them off to vehicles or by reducing speed limits and preventing thru traffic. Micromobility parking is easier to transfer from car parking space.

Constructing bike infrastructure around existing road infrastructure adds significantly to the cost. The Bay Bridge in San Francisco is an extreme example: the city projects that extending the existing bike lane over the western span would cost $300 million (or about $100 million per mile) and closing a lane of traffic for this purpose is considered politically unfeasible.

Yet the dramatic rise of micromobility has highlighted the importance of dedicated infrastructure to support these trips. The subsequent COVID-19 pandemic has further forced cities to contend with the current imbalance in infrastructure, with many local governments closing off some roads to allow increased walkability and micromobility. However, converting a few streets in a few cities is insignificant compared to a systematic reevaluation of urban space. This reexamination is starting to happen, especially in European cities like Paris, Milan and London that are seeking to prioritize alternate modes ahead of cars.

A map of the world showing how cities are beginning to prioritize alternative mobility modes with the following examples: Montréal: Added 300km of new, temporary pedestrian and micromobility paths over the summer of 2020 and hopes to increase the share of commutes done by bike to 15% over the next decade; Bogota: Plans to add an additional 280km of micromobility lanes to the existing 550km network with the long term goal of of shifting 50% of trips to cycling and other micromobility alternatives; New York: Is building a network of 1,375 miles of micromobility lanes (the largest such network in the US), 120 miles of which have been built since 2014; also replacing car lanes with micromobility lanes on the Brooklyn and Queensboro bridges; UK, France & Italy: Each announced €300 million of spending on micromobility infrastructure since the start of the pandemic and 2,300km of of new bike lanes have been rolled out across the continent; Copenhagen: Has built out an expanded 167km network of regional micromobility "superhighways" with lighting, wide cycle tracks, repair stations, and timed intersections; Amsterdam: Will be removing over 11,000 car parking spaces from the city centre by 2025 (1,500 per year), to be replaced with bicycle parking, street trees and better walking environments; Tel Aviv: Planning to more than double the network of micromobility paths from 140km to 300km (compared with 850km of roadway) over the next five years

Sources: Montreal; Bogota; New York; UK, France and Italy; Amsterdam; Tel Aviv; Copenhagen

Nevertheless, well developed micromobility infrastructure is still the exception rather than the rule in cities around the world, especially outside of Europe. For instance, the Australian Bicycle Network created a Pop-up Bike Lane scoreboard which compares announcements of micromobility lanes to a game of Aussie rules football (¯\(ツ)/¯). The scoreboard reports "still awaiting moves" alongside the names of the mayors of most major cities.

Even in cities that have approved micromobility infrastructure plans, progress can be slow: In 2018, Seattle built just 2.3 miles of the 10.4 miles of protected micromobility lanes it had planned for that year. This was part of a multi-year project approved in 2015 to build 50 miles of new micromobility lanes, but due to slow progress and cost overruns, the city was looking to cut back significantly before the pandemic. In parallel, Seattle has also been a laggard in allowing micromobility services to operate, blocking the launch of scooter sharing until late 2020 and then imposing a range of restrictions.

Throughput Construction Cost (TCC)

Considering these four transportation infrastructure networks, the goal of urban planning is to ensure that the best type of infrastructure is built to facilitate trips while minimizing negative externalities. But how to think about these tradeoff decisions?

Throughput is obviously an important factor, but so too is cost. In order to have a tool for thinking about this tradeoff, I propose a metric called Throughput Construction Cost (TCC) which is essentially a measure of how many dollars need to be spent per unit of throughput capacity created for various types of mobility infrastructure (represented by the bars in the chart below). It's calculated by dividing average per mile construction costs of each type of infrastructure by the maximum throughput capacity of that mode. A lower TCC is better since it means that additional capacity can be built more cheaply. The red line shows the maximum throughput of each mode as per the chart in Part 1.

Bar chart showing Throughput Construction Cost (TCC) of various transportation infrastructure types (Pedestrian, Micromobility, BRT, Mixed traffic, Light rail and Subway) and an overlaid line chart showing max throughput capacity of the same modes

Source: Calculated based on maximum throughput ranges (averaged) and US construction costs (averaged) detailed above

As the chart shows, pedestrian and micromobility space offers by far the cheapest throughput and they also have significant capacity since they allow people to travel closely together. Car space throughput is much more expensive, but still a lot more affordable than most forms of transit. But it has very low maximum throughput, therefore requiring massive amounts of infrastructure to allow sufficient capacity, as we see in most cities today.

Chart showing congestion worsening over time in the US and with it, average travel time has increased 25% and average commute speeds have declined by about the same proportion

Source: 2017 National Household Travel Survey

Though micromobility, and to a greater extent walking, have speed limitations, across the US the saturation of car space has caused travel speeds to decline steadily to not much faster than a scooter on average. In dense urban areas, these effects are even more pronounced: in Manhattan average travel speeds are just 7 miles per hour making Citi Bikes faster than cabs across all distance categories. Transit in contrast is extremely expensive for the throughput it offers, but it does offer by far the greatest overall throughput, making it important in dense cities where space is at a premium.

TCC highlights why inflated US transit construction costs matter. Madrid's metro extension, which added 75km (46.6 miles) of track, more than 75% of which was underground, cost about €2.74 billion at the time (about $4.3 billion adjusted to 2020 dollar values). That equates to less than $93 million/mile. Even assuming a somewhat lower maximum throughput, that puts the TCC of this project in line with road infrastructure.

Martha CAT card, "I've been waiting for you. Or is it you who've been waiting for me?"; she represents a bus; "Staffing instructions: Portly and congenial, but prone to wild mood swings. Sometimes scoots off just as you approach and at other times will stand around impassively or amble away slowly."

There's also an interesting trade-off between bus rapid transit (BRT) and light rail for lower density transit, relevant to many US cities. Although both have similar throughput capacity, BRT construction cost is similar to road construction making it significantly cheaper than rail infrastructure, giving it a significantly better TCC. However, operational costs are higher and service quality is lower. Light rail also benefits from "rail bias" meaning consumers are more likely to switch to using it than a bus service, which is perceived more negatively. Though for much of the world buses are still the most effective form of transit, negative perceptions are self-reinforcing. We might like buses more if they were marketed as well as cars, as this Danish ad strikingly illustrates.

It's a testament to the generative power of cities that high-cost transit can make sense in spite of the massive investment required. However, the clear takeaway from this high-level analysis of TCC is that micromobility lanes and sidewalks have the potential to deliver much greater value than any other infrastructure mode. Certainly this isn't a panacea: capacity is not the same as actual utilization. But for utilization to happen, an infrastructure network must be viable.

Network viability

Transportation infrastructure benefits from network effects: The value of the network grows as its size increases. Furthermore, the marginal value of a mile of micromobility lane or transit infrastructure is greater at the center of the network than at the edge since it enables exponentially more trips. Conversely, car infrastructure suffers from diminishing returns since new lanes are mostly being added to the edge of the network making capacity increases fractional. In order for a network to have high utilization, it needs to be built out to a sufficient extent. Cycling, walking or taking transit become a lot more viable when it's possible to complete most trips with these modes.

Across the 50 largest US cities, only 1.2% of people commuted by bicycle. Though Copenhagen and Seattle have a similar climate and population size, in Seattle just 3.1% of people commute by bicycle (which is high by US standards), compared with around 50% in Copenhagen. This is in spite of the fact that about 48% of Seattle car trips are less than 3 miles, making micromobility a good substitute. The biggest driver of this is almost certainly a viable micromobility infrastructure network: Seattle had just 3.2 miles of protected bike lanes in 2014; the remaining 134 miles of bike lanes were shared with vehicles or minimally separated. In contrast Copenhagen, has 513km (319 miles) of protected micromobility infrastructure in the city and an additional 167km (104 miles) of "super bike lanes" for longer distance commuters coming into the city.

The challenge is to find the right allocations between different transportation modes. This includes grade separations at the points where networks intersect to make them safer and more efficient to use. The size of networks can be scored along with their level of integration and these metrics can be used to make tradeoff decisions between infrastructure types.

Chart showing how currently 81% of Vancouver's street space is dedicated to cars and how the city is planning to reallocate 11% of road space to correct the disparity between mobility infrastructure and how people use it (although a gap remains since only 46% of travel is done by cars according to survey data)

Source: Making Streets for People, City of Vancouver

There are other indirect benefits to building out a network of pedestrian and micromobility friendly infrastructure: Salt Lake City found that converting parking spaces into micromobility lanes leads to higher sales by retailers along the route and that most residents preferred the urban environment created by this change. Transport for London determined that walking and cycling improvements can increase retail spending by 30% and improve health and environmental outcomes while also increasing throughput capacity. In contrast to parking minimums which add costs to real estate development, proximity to micromobility and walking infrastructure has been shown in numerous studies to increase property values.

The semi-dense car-scale nature of American cities makes it hard to shift behavior since cars have been set up as the default mode. This makes it hard to shift things back to a human scale, a bit like how hiring a cheap electrician to install the wiring might solve the immediate challenge while creating greater longer-term costs and complexity. But that doesn't mean there is no remedy. People are flexible and mobility solutions are becoming increasingly flexible too. For instance, a study of San Francisco housing lottery recipients showed that the availability of alternate transportation options significantly shifts mode choices, irrespective of the pre-existing preferences of residents.

Windows computers used to run this process called defragging that would free up disk space by rearranging files to be contiguous with one another (it happened to have a riveting visualization). Similarly, urban infrastructure is in need of a defragmentation process to minimize unnecessary non-spaces. The distortions of urban space are a consequence of misdirected subsidies to car infrastructure and the absence of efficient market signals to optimize mobility systems. This change needn't be prescriptive: urban defragmentation is simply about creating a level playing field in which subsidies are clearly accounted for and car ownership is not given an unfair advantage at the expense of the greater good. Fortunately, the trip economy can significantly improve outcomes if given the freedom to do so.

Space for the trip economy

Low TCC means that micromobility infrastructure networks can be built out affordably to reach network viability and sidewalk space expansion can also be more easily justified. But just because throughput capacity can be increased affordably doesn't guarantee that it will be used. That's where the trip economy comes in.

The Next Big Thing CAT card, it represents the next big thing; "Staffing instructions: This card imitates a card already in play, bud adds +1 to each utility property."

Just as the trip economy creates a grindstone to work down the inefficiencies of vehicles and build out fleets optimized for particular use cases, it also leverages infrastructure to find the most efficient outcomes. Induced demand is a sign that there is significantly more demand for trips than what cars and road infrastructure capacity can support and that road networks can't expand quickly enough to meet this demand. However, the marketplace model of the trip economy means that if cities build out sufficient micromobility infrastructure, which allows dramatically increased throughput capacity, the trip economy will find ways to fill it while balancing these trips against other infrastructure network modes. This system is dynamic. It leverages free market principles to allow consumers to make the choices that best fit their needs traded against the true costs of facilitating such trips, including available infrastructure.

The boom in micromobility startups over recent years is this principle in action. By highlighting this opportunity, rapid micromobility deployments have forced the acceleration of micromobility lane construction (and in the process shifted the meaning of these networks, which are elsewhere more narrowly described as bike lanes). Already logistics fleets and in particular food delivery are finding ways to use this space, while reducing demand for road infrastructure in the process. Going forward, so long as there is sufficient infrastructure investment, the innovative power of the trip economy will continue to find ways to expand into this space and broaden the types of vehicles that can utilize it. Similarly, the trip economy can also increase utilization of pedestrian space by sharing it with new vehicle types such as slow-moving sidewalk drones that are powered by autonomy and teleoperation.

Things to measure and to price

A drawing of how DOGs and CATs must be kept in cosmic proportion to arrive at The Good

The trip economy not only incentivizes greater utilization of infrastructure capacity, but also gives tools to address the various externalities that affect transportation by giving a precise way to price almost anything that can be measured into the cost of a trip. In the process, it also puts into relief the negative externalities of owned assets and enables broad policy shifts that address the costs of car storage, congestion and road utilization. What follows are some specific ideas for how the trip triangle introduced in Part 1 can be applied to specific externalities.

Throughput

According to Texas A&M's Urban Mobility Report, over the five-year period from 2012 to 2017, individual congestion delays increased 15% and associated costs increased 11%, bringing them above $1,000 a year for the average American. On a national level, congestion delays cost America $179 billion and increased by 19% between 2012 and 2017. Congestion is most severe in large cities, but it has worsened even in small cities by more than 50% to more than 35 hours per year over this period (large city delays are more than double this).

Line chart showing measures of US individual congestion in delay per commuter, wasted fuel per commuter and congestion cost per commuter, all of which have grown steadily from 1985 through 2015

Source: Texas A&M Urban Mobility Report

Congestion is a classic tragedy of the commons which means that pricing offers a good solution. The things that reduce throughput (such as traffic at rush hour) should be priced and the things that increase it (like high-capacity transit or micromobility lanes) should be subsidized. Pricing within the trip economy is the easier part; charging private cars is harder to do dynamically and in a way that is enforceable, transparent to drivers and minimizes unnecessary friction, but improving technology helps. Tightening infrastructure budgets also give an incentive to overcome political resistance, starting with specific routes and expanding from there.

Within trip marketplaces, prices can accommodate congestion charges dynamically - Grab already does this in Singapore. But there are also two trip economy-specific congestion-related externalities worth considering.

Curbspace

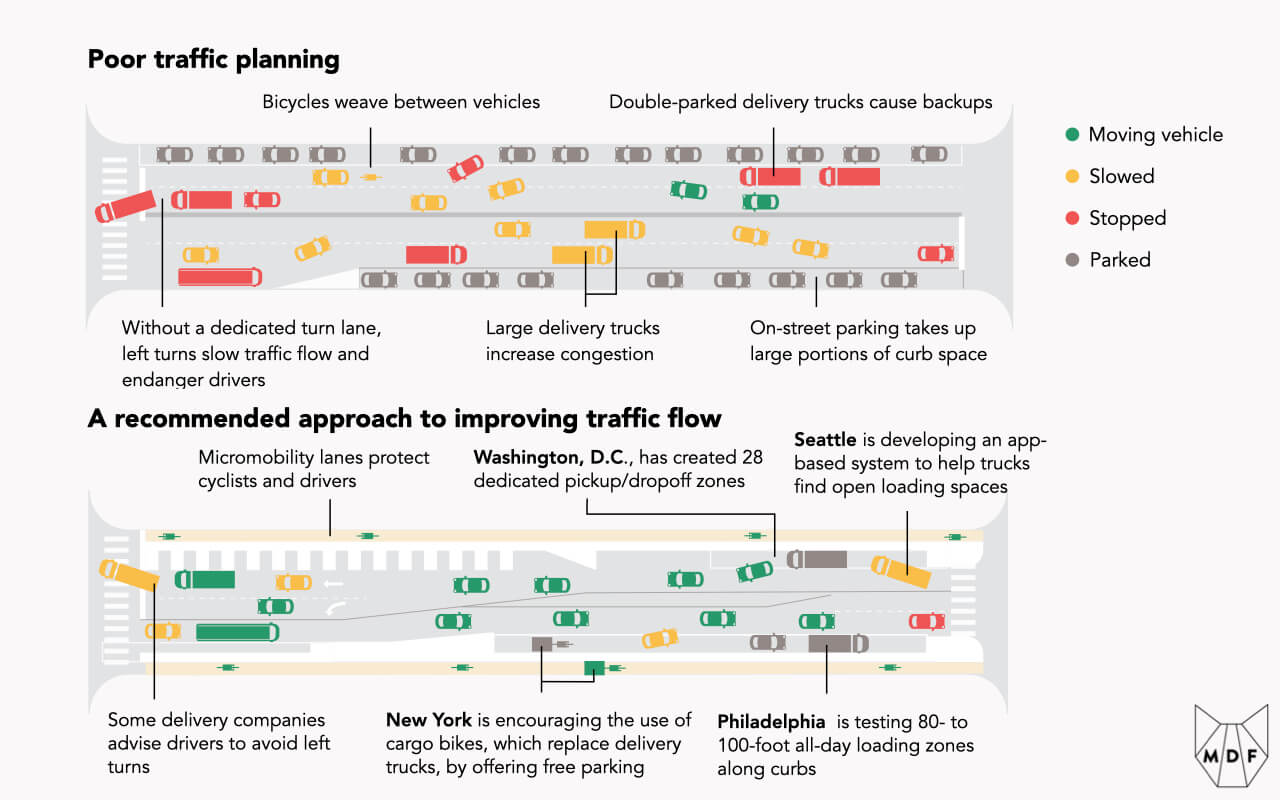
The first is curbspace. Mobility solutions use infrastructure differently. In contrast to owned vehicles which are stationary the vast majority of the time, shared vehicles only stop for a few minutes at the beginning and end of a trip (whether it is an e-commerce delivery, food delivery or ridehailing pickup or dropoff). But when they do stop, they risk blocking thoroughfares and so it is important to manage the space they use to do so effectively. Pricing curbspace is a good way to address this.

Visualization of two alternate traffic planning scenarios: a poor scenario in which delivery vehicles increase congestion, on-street parking consumes curb space, bicycles have no clear path and must weave between vehicles, etc and a recommended approach in which micromobility lanes protect vulnerable road users, drop-off zones are set aside and traffic flows are improved overall

Source: WSJ

Empty miles

The second trip economy specific challenge is empty miles. After a trip is completed, fleet vehicles have a period when they are carrying no passengers or cargo. While this is hard to avoid, it is worth considering how to minimize it. Without a broader system of congestion pricing for all vehicles, what seems most effective is to subsidize the positive side of this equation: pooled rides and batched deliveries.

Safety

Mobility involves risk; injuries and deaths are an unfortunate consequence of people moving at velocity. However, from the perspective of safety the goal should be to minimize severe accidents.

A chart showing annual US road fatalities, which have stayed stable at around 40,000 people per year over the last decade

Source: NSC

There is significant variability in outcomes: In contrast to the US, where 39,107 people were killed by vehicles in 2019 while over 4.4 million sustained injuries requiring medical attention, in Norway the number killed was 108 with 565 severely injured, a rate about six times lower when adjusting for population. In the capital Oslo, with a population of about 635,000, only one person died on the roads in 2019. Bad mobility safety outcomes are not inevitable.

For the most part, cars are what make roads dangerous, especially when they interact with more vulnerable road users such as pedestrians and cyclists. This has become a bigger problem over time because of the growing popularity of SUVs, which are heavier and more stable during a collision making them safer for the people inside but significantly more dangerous for the people around them.

A bar chart showing how SUVs have grown from nothing to 23.7% of US household vehicles from 1990 to 2017 and a pie chart showing how they now constitute 34% of new vehicle sales

Source: 2017 National Household Travel Survey

Because cars are seen as the default mode, vulnerable road users are the ones expected to behave defensively rather than drivers. This is akin to arguing that the best response to school shootings is for children to carry guns to defend themselves. Israel offers a striking example of this general bias at work: when a drunken driver killed a 17 year old on an e-bike, regulators responded by increasing restrictions on micromobility.

Drawing showing how road space is no man's land which we cross at our peril

What Oslo did to successfully transform safety outcomes was to pedestrianize its city center. This involves ensuring that infrastructure for more vulnerable transportation modes is separated from heavy vehicles and that heavier vehicles are forced to travel more slowly. But pricing can also be used to reduce road danger by charging vehicles according to both weight and speed. The revenue generated could be invested into improving infrastructure.

Pollution

The combustion of fossil fuels remains the primary source of energy in transportation and accounts for 24% of all carbon emissions. It's not just the global climate that is affected by the gases that vehicles emit, but also the quality of air in cities around the world. The World Health Organization attributes around 3 million deaths each year solely to ambient air pollution, more than double the number killed in road accidents. Densely populated and rapidly industrializing countries like India and China have particularly severe air quality problems; Asian cities occupy the first 148 spots in worst air quality rankings.

Chart showing average annual population-weighted PM2.5 with India suffering the worst particulat pollution, followed by Nigeria; China in the middle and Indonesia, Japan, Germany and Brazil and significantly lower levels; US has the best air quality in the cohort and the only country below the WHO air quality guideline

Source: State of Global Air

In recent years, China has achieved steady improvements in air quality and India is also starting to move in the right direction as pollution has become a larger focus of policy. Beyond this, leaders around the world are increasingly resolving to reduce greenhouse gas emissions, and transportation is a central aspect of this focus. The growing popularity of electric vehicles creates a viable pathway to transform the transportation energy equation and the pandemic-related stimulus spending has given governments, especially in Europe, a powerful tool to boost clean energy vehicle sales.

Chart showing global CO2 emissions in transport by mode and how they could decline according to the sustainable development scenario between 2000-70

Source: IEA via Our World in Data

However, for the most part, policies designed to incentivize electric vehicle uptake are premised on replicating the ownership model around a cleaner powertrain. However pollution in transportation is largely a consequence of the inefficiencies of the current system, which lacks good mechanisms to link pollution to trips or passenger miles and price in the accompanying externalities accordingly.

Chunk DOG card, "Am I in your way? Or is it you who are in my way?"; he represents an SUV; "Owner guidelines: A peerless decathlete, big and friendly, so long as you stay on his good side. But watch out, if you get on the wrong side of him, he's sometimes meaner than he intends to be."

Vehicle weight is not only what makes cars dangerous, but also the primary input for vehicle energy use and resulting pollution (which remains a challenge for electric vehicles since most grid energy is not renewable) and the rising popularity of SUVs around the world creates a significant challenge to reducing emissions. In contrast, smaller vehicles not only have a lighter footprint in terms of road space utilization, but also tend to be electric and require significantly less energy to operate. Yet they haven't received anything like the subsidies that large, expensive electric vehicles do; a bill proposing a 30% subsidy to e-bike purchases introduced by Congressman Jimmy Panetta is the exception that proves the rule.

The trip economy not only gives tools to regulators to adjust for externalities such as pollution, but more importantly it is built on a competitive model that rewards greater efficiency. Shared micromobility is a cheaper option because it cuts the energy budget for trips dramatically. Meanwhile, logistics and transit fleets have been among the most rapid in adapting electric vehicles since they need the operational savings these vehicles can unlock in order to stay competitive. Tellingly, in emerging markets like India where smartphone adoption has led to a surge in e-commerce, it is delivery fleets that are most aggressively looking to electrify in order to save on operational costs.

Labor

Labor is probably the most controversial topic surrounding of the trip economy. It has been the focus of many, many protests, court rulings and a critical ballot referendum.

Line chart showing that among online platforms, transportation apps have seen the strongest rise in employment, growing to about 1% share of US households earning income on platforms monthly

Source: JPMorgan Chase Institute

Trip economy "gig work" is a small but fast-growing subset of work done by independent contractors. Such workers lack the benefits and security of full-time employees, but have greater freedom over what they do and when they do it. Already in 2016 McKinsey estimated that independent contractors made up 27% of the US labor market, and more than half of workers younger than 25. Within this category, "gig work" is generally enabled by fast growing digital platforms such as Airbnb, TaskRabbit or Uber. Though trip economy on-demand labor is still a small portion of independent contractor work, it is controversial because it serves as a proxy for the broader impact of digitization on labor.

The trip economy is premised on price signals and competition creating greater supply side efficiency. Labor is an input into this equation and trip marketplaces generate greater efficiency here too. There's a positive and negative side to this.

The good side is that drivers have a way to generate income as easily as they have for spending it: they just need to open an app and start driving, whenever convenient for them and for however little or much time they choose to do so.

But this convenience and flexibility also makes it easier to swap one driver for another by leveraging price signals and other marketplace dynamics. And this is the downside: gig work doesn't have the predictability and stability of full-time employment.

This tension between flexibility and stability carries over to earnings. On the one hand, the flexibility of the gig economy has unlocked a large pool of opportunity by creating an appealing arbitrage: letting consumers have someone else do the driving for them. Most people can drive so ridehailing and other trip economy platforms have created a revenue stream for millions of people who might not have other options. However, as the pool of driver labor on these platforms has surged, earnings have decreased considerably as market forces are put to work. JPMorgan Chase found that between 2013 and 2017, the average earnings per drivers more than halved even as the combined earnings pool for all drivers increased about tenfold. The effervescence of trip labor is amplified during a recession (although full-time employees working for trip economy startups aren't necessarily protected against this).

The power asymmetry between a centrally managed platform that benefits from network effects and a dispersed pool of gig workers raises important questions about the role of policy. This problem is exemplified by the ability of platforms to shift prices and incentives or even discount how much they pay workers by however much customers choose to tip. In addition, gig drivers might not factor in the true cost of vehicle ownership when considering driving for a trip economy platform, and may therefore overvalue their earnings.

Just as the trip economy is both enabled by and threatened by dematerialization, so too is labor within and beyond the trip economy (for instance through automation and new services). Globalization is a consequence of increasing digitization and labor disruption is a key driver of populist sentiment which has grown more polarized. Gig work is disruptive in developed markets where full-time employment is ubiquitous, but in emerging smartphone-centric markets, it is increasingly the norm and creating new categories of work for those most eager for it. Certainly there are challenges to navigate, but also opportunity.

Bar chart showing that the gig economy supports a growing portion of the global labor market, especially in emerging economies like China (where gig work serves as 8% of primary income and 31% of secondary income) and Indonesia (3% of primary income and 23% of secondary income); US is at 4% of primary income and 10% of secondary income

Source: BCG

The good news is that like in other cases, the trip economy gives information and control to regulators where before there was little. The key challenge is to structure stabilizing benefits that fill the gaps created by the relative flexibility of new employment models. This is fundamentally about facilitating greater predictability while protecting against unexpected events.

Part of the challenge is not just new models of work, but the problematic structure of existing employment frameworks. This is particularly acute in the US where healthcare is extremely expensive, but insurance to pay for it is usually tied directly to employment. The Aspen Institute has proposed creating portable benefits tied to workers rather than employers. Arguably, this framework has started to take root through compromise initiatives such as Prop 22 in California, which guarantees gig workers minimum earnings and stipends for healthcare. And (for better or worse) it seems likely to serve as a model for trip economy labor in other states, and perhaps significant other aspects of the labor market beyond this.

Upward mobility

Cities are economic engines because they bring people into close proximity, increasing the velocity of interactions and therefore productivity. The strength of a city in creating opportunity is correlated to its level of connectivity. We should aim to improve overall connectivity across cities while lowering the cost of trips. When it is easier and cheaper to move, parents can send their children to better schools and find better work for themselves. Meanwhile, people with disabilities as well as the elderly, who would otherwise be trapped at home, are given new freedom through affordable and accessible mobility services. There's a reason why the term "upward mobility" includes the word mobility.

Access to reliable and affordable mobility is perhaps even more important in developing countries where transportation infrastructure is less developed. In such places, mobility solutions such as digitally enabled intracity bus services can fill in gaps where transit is lacking, unlocking opportunity for a great many people. Tools such as dynamic routing and pricing as well as unified payments systems enable solutions that can leapfrog high rates of car ownership and accelerate development in the process.

The trip economy can expand access beyond existing transit solutions. There is already evidence that ridehailing services offer significantly better coverage with less discrimination against passengers relative to taxis, in addition to lowering trip costs. But price is still a barrier for many.

Just as transit is subsidized to improve equity, targeted subsidies for trips can have a similar effect, but can be more precise in providing these benefits to the people that need them. Mobility marketplaces can also work in concert with established transit networks to the extent that these systems can be effectively integrated. On the whole, inequality is often rooted in disparities in housing, so better mobility can help correct for this by improving access from and within underserved neighborhoods. Conversely, the suffocating effects of nimbyism are weakened when there are more routes around the backyards of those seeking to prevent change.

Over time, new technologies and business models can structurally reduce trip costs. Already shared rides and micromobility offer lower per trip costs, giving options to people who can't afford cars. Longer term, automation can help make ridehailing and delivery services significantly more affordable and in the process universalize the trip economy.

Our glorious future

Glory CAT card, "I am the truth, the way and the life. No one will get anywhere if not by me"; they represents an autonomous vehicle; "Staffing instructions: Perfect. In the future. When you play this card, you automatically win."

There is a shimmering point on our horizon in which autonomous vehicles solve all our mobility challenges. They will be safe, efficient, clean, electric and provide affordable mobility to everyone who needs it. The prophets of this future are already arriving in the form of the multifaceted trip economy and its rapid supply side evolution. In parallel, digital technologies which support mobility marketplace growth are simultaneously enabling dematerialized services which also address trip needs of people across the world.

Or perhaps the future won't be better, even when the dream of autonomy is realized. Already headlines forecast dark challenges, warning how these vehicles will steal jobs and circle the block aimlessly, optimized apparently to make the world a less happy place. And economic growth does not create a straight line to improved outcomes for all.

We will always be "divinely discontent," Jeff Bezos notes. "We didn’t ascend from our hunter-gatherer days by being satisfied."

It's hard to know exactly what the future holds. But what's important that we get to choose.

The goal of MDF is not to say how the world should be. It is to start a conversation while giving the tools to frame this discussion. It points specifically to the levers that can effect specific changes, depending on what communities chose to price into the mobility equation. Though improving mobility efficiency has clear benefits, it is not the only goal. Mobility needs vary widely as do cultural preferences. The virtue of a framework is that it helps you think about what is possible and gives tools for comparing different ways the world could be.

But there is a big difference between looking at the world with or without glasses on when reality is blurry. This is true when driving a car, and even truer when shaping the broader systems it fits into and determining the direction where things are headed.

Share this chapter with others:

Did you enjoy MDF? We'd love to get your thoughts!